1. Odd-lot trading: The odd-lot rule gives us an indication of what the man on the street thinks about the stock (As he gets more enthusiastic about a stock this ratio will increase).
2. Mutual Fund Cash positions: Historically, the argument goes, mutual fund cash positions have been greatest at the bottom of a bear market and lowest at the peak of a bull market. Hence investing against this statistic may be profitable.
3. Investment Advisory opinion: This is the ratio of advisory services that are bearish. When this ratio reaches the threshold (eg 60%) the contrarian starts buying.
Detecting shifts in Demand & Supply: The Lessons in Price Patterns

Breadth of the market
Measure: This is a measure of the number of stocks in the market which have advanced relative to those that have declined. The broader the market, the stronger the demand.
Related measures:
(1) Divergence between different market indices (Dow 30 vs NYSE composite)
(2) Advance/Decline lines
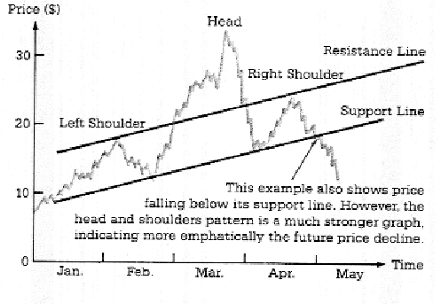
Support and Resistance Lines
A common explanation given by technicians for market movements is that markets have support and resistance lines. If either is broken, the market is poised for a major move.

Possible Rationale
(1) Institutional buy/sell programs which can be triggered by breakthrough of certain well defined price levels (eg. Dow 1300)
(2) Self fulfilling prophecies: Money managers use technical analysis for window dressing.
Prof. Aswath Damodaran
Next: Moving Averages
Summary: Index