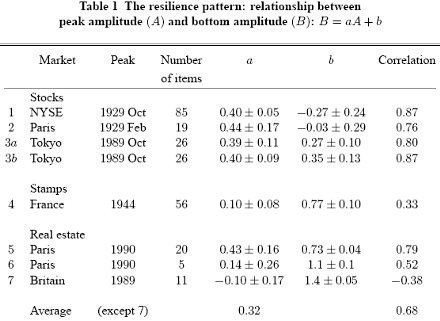
The consideration of other speculative markets relies on the implicit assumption that the basic mechanisms of speculation are similar for any speculative market. In this paragraph we examine the cases of postage stamp and real estate markets. These markets are particularly suited for this kind of investigation because (i) they have large price peaks and (ii) they comprise a large number of different items which will play the same role as individual stocks or economic sectors in our previous study.
During Word War II there was a postage stamp bubble in France which was triggered by the fact that inflation was high (the consumer price index increased from 130 in 1941 to 350 in 1945) while at the same time, due to war restrictions there was only a small outlet for consumption. Thus almost all stamps experienced a price peak (usually culminating in 1944) with their real (i.e. deflated) price multiplied by a factor of 3 or 4. The present investigation focuses on 19th century French stamps.
Table 1 shows that the correlation between peak and bottom amplitude although still significant is smaller than in previous cases. This can possibly be attributed to the fact that the prices given in stamp catalogs are estimates made by stamp experts and traders rather than real market prices. Estimates are particularly difficult to make for stamps which are not traded very often; such is the case for the stamps which are particularly rare and expensive. Now (see in this respect [11] ) the expensive stamps are also those for which the peak amplitude A is largest and any bias for large A sample points will notably affect the correlation and the slope of the regression line.
Our next example concerns the real estate market in Paris. Between 1985 and 1995 there was a price peak which resulted in a doubling, and in some areas a three fold increase, of apartment prices. First, we consider the prices in 20 different districts (“arrondissements”) of downtown Paris (i.e. the socalled “Paris intra-muros” area). The regression leads to values for the correlation and for the slope of the regression line which are similar to those obtained in the case of stock markets. As shown in Fig.5 the sample points in the (A,B) plane are evenly distributed along the regression line and do not display any obvious non-linear effect.
The second result concerns the same price peak but for apartments according to their size (from oneto five-room). Not surprisingly, due to the small number of sample points the error margin is fairly large; note that the value a = 0.4 obtained in previous cases is within the error bars. Up to that point all our results were consistent with the resilience pattern, but the following case lead to an unexpected result. It concerns the real estate bubble which occurred in Britain in the 1980s; from the area of London where it started, it spread progressively northward to the rest of the country.
Price results can be analyzed at the level of each of the 11 regions composing Britain. The result came as a surprise; in this case the amplitudes are negatively correlated and the correlation is fairly low. In order to see if the negative correlation is found elsewhere it would be of great interest to perform a similar test for other countries; unfortunately, in France reliable regional housing prices are only available since 1995.

Notes: All prices used in the regression are real (i.e. deflated) prices. Case (3a) refers to t1 = 1985, while case (3b) refers to t1 = 1980. For some reason yet to be understood the housing bubble in Britain does not follow the resilience pattern (negative correlation).
Sources: 1: [1]; 2: Annuaire Statistique de la France, R´esum´e R´etrospectif (1966, p.541); 3a,b: Japan Statistical Yearbook (various years); 4: [5]; 5,6: Conseil par des notaires (23 Dec. 1991) and Chambre des Notaires; 7: Halifax index.
By Dr B.M. Roehner
Next: Conclusion
Summary: Index