Most charting methods, including classical charting, make use of implied psychological or behavioral motivations. For instance, “doubt” is the emotion usually associated with the early stages of a new trend. After a trend has matured, “greed” or “fear” are thought to be the forces that compel traders to “chase” prices up or down even farther, culminating in a frenzied “climax” of buying or selling activity.
Elliott wave structures are believed to directly reflect a rhythm in nature that manifests itself in “crowd behavior,” and ultimately in the shape of market prices. Classical chart patterns, such as head-and-shoulders, triangles and others, are thought to be indicative of “pool operators” or “inside interests” who intentionally manipulate the market in distinct phases referred to as accumulation, markup, distribution, and markdown. Regardless of the underlying causes attributed to their formation, classical chart patterns rely chiefly on the interpretation of trendlines, geometric formations and price and volume relationships.
The primary chart patterns that Schabacker pointed out in his first book, Stock Market Theory and Practice, included patterns of accumulation or “bottoming,” and patterns of distribution or “topping.” Collectively these patterns are known as “reversal” patterns as they tend to coincide with a reversal of the prior established trend. Schabacker also identified a second group of patterns as “intermediate” or “continuation” patterns that are found “inserted in the progress of an already originated move.”
As their name implies these patterns suggest only a pause in activity followed by a continuation of the preceeding trend. The fact that a chart pattern appears as either a reversal or a continuation pattern does not rule out plentiful exceptions. For instance, an “orthodox” head-and-shoulders reversal pattern may develop into a continuation pattern, or vice versa. Most of the literature on classical chart patterns concedes this flaw. What can be said with moderate certainty however is that when prices have been in a trend and suddenly stop advancing or stop declining, they are now “doing something else.” That “something else” is almost always the start of a classical chart pattern of one form or another.
Over time and depending on which analyst or trader you consult, individual patterns within each category have gone through minor name changes and other slight revisions. For example, Schabacker originally identified “wedges” as a reversal pattern, while other technicians have accepted the wedge pattern as both a continuation and a reversal pattern. However the names and categories of the basic “area” patterns, which exclude all one and two-bar formations such as “island” and “gap” patterns, as well as “spike” or “V” reversals, can be broadly summarized as follows:

In addition to identifying specific pattern “shapes,” classical chart pattern analysis also incorporates an analysis of the relationship between price and volume. For example, a price “breakout” is believed to confirm a pattern’s validity if it is accompanied by increasing volume. In the case of top reversal formations, this requirement is sometimes relaxed.
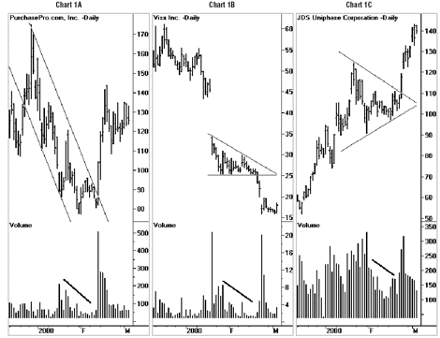
However, in general, most chart patterns tend to follow a sequence of high and/or irregular volume in the early to middle stages, with markedly declining volume in the late stages, just prior to prices “breaking out” beyond the boundaries of the pattern. There is as Schabacker explained, “…the tendency for volume to decline during the period of formation of a technical area pattern. This shrinkage in activity is especially conspicuous as the formation nears completion, just before a breakout occurs.”
Charts 1A-1C demonstrate actual examples of this behavior. Another feature of classical chart patterns is the implied price target. Following the confirmation of a pattern, which is normally signified by a price “breakout,” chartists believe that targets can be determined that indicate how far prices will either rise or decline. The standard procedure for determining a price target is to measure the width of the pattern, in points or dollars, and then add or subtract this value above or below the point at which prices decisively exit the pattern.

By Daniel L. Chesler, CMT, CTA
Next: Role of Classical Chart Patterns
Summary: Index