Here, we primarily make the fitness and statistic test with the actual trading data of the points of stock index, the synthesis index of Shanghai stocks market (SISH), and prices of stock, Shenzhen Development Ltd.(SDL).
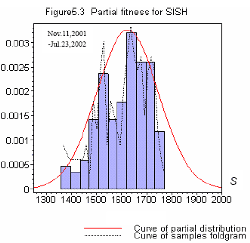
The fitness for SISH. We take the close points of SISH as sample data.
Time: Nov.11, 2001-Jul.23, 2002.
Trading days: n=152.
Length of each field: ∆=13.51940790.
Number of fields: m=28.
The estimated results of parameters are as follows:
(a) The estimated values of parameters in partial distribution P (µ, σ2):
µ ˆ =1623.037149;ˆσ2 =14982.02741;
(b) The estimated values of parameters in lognormal distribution Ln ( µl, σ2l):
µl= 7.381044703; ˆ σ2l=0.003609184920;
(c) The fiducial test:

The corresponding histogram, samples foldgram and fitting curve of Partial Distribution are shown in the figure 5.3.

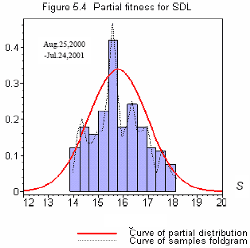
The fitness of SDL. We take the close prices of SDL as sample data.
Time:Aug. 25, 2000—Jul. 24, 2001.
Trading days: n=215.
Length of each field: ∆=0.20 (R.M.B.).
Number of fields: m=22.
The estimated results of parameters are as follows:
(a) The estimated values of parameters in partial distribution P (µ, σ2):
µ ˆ =15.79142884;ˆσ2 =1.390993710;
(b) The estimated values of parameters in lognormal distribution Ln ( µl, σ2l):
µl= 2.758404582;ˆ σ2l=0.004032994141;
(c) The fiducial test:

The corresponding histogram, samples foldgram and fitting curve of Partial Distribution are shown in the figure 5.4.

Prof. Feng Dai, Prof. Zifu Qin
Next: Comparison Research Between DF Structure Pricing and B-S Pricing
Summary: Index