The forecasting models were estimated over the first 2500 data observations and their forecasting ability compared to a random walk (with and without drift) over the remaining sample, thus sparing roughly 10% of the total sample for forecasting. The drift component for the random walk model was estimated as the mean of the absolute changes of the Close series. Even though our model is able to forecast the Close, the periodic High (Max) and the periodic Low (Min) prices n-steps into the future, only forecasts of the Close series were considered. Only these forecasts represent a “true” forecasts in that they assign a certain value to a specific point in time, i.e. a forecast of tomorrow’s Close represents a forecast of tomorrow’s spot rate at 1700 hours.
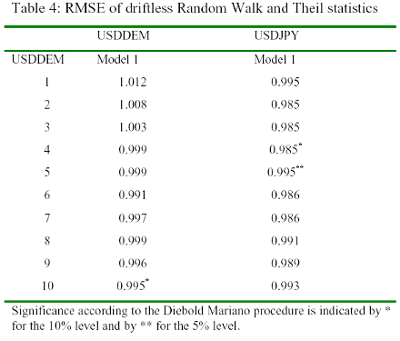
A forecast of the Max or Min, however, does not reveal any information at which time of day this value is to be expected and thus is of little use under market timing considerations. Since the classic paper of Meese and Rogoff (1983), the crucial factor in determining the worth of an exchange rate model is how well it forecasts in an out-ofsample context relative to a random walk, using the metric of root mean square errors (RMSEs). In Table 4, the Theil statistics are calculated as the ratio of the RMSE of the forecasting model over the RMSE of a driftless random walk22; a value equal to one indicates equal forecasting accuracy, a value smaller than one indicates that the forecasting model outperforms the random walk and a value bigger than one indicates that the model does worse than the random walk in respect of root mean square error minimisation. The significance of the Theil statistics are tested using the Diebold- Mariano procedure (1995).
This tests the null hypothesis of equal forecasting accuracy of two alternative forecasting models by regressing the difference of the RMSE of the two alternative forecasts on a constant. The Newey and West correction for heteroscedasticity and serial correlation (induced by overlapping observations with multi-step forecasts) is used to adjust the standard errors. From an investor’s point of view a forecast that correctly predicts the direction of change is more useful than RMSE minimisation and so we also present a test of directional forecasting ability.
The significance of the directional forecasts were tested using the regression-based Cumby-Modest (1987) statistics, which are robust to moving average errors. According to the Cumby-Modest approach a model provides value if it correctly predicts the sign of subsequent large changes, even if it gets the direction wrong on average. As can be seen from Table 4, the USDDEM model performs very well, compared to the random walk forecast. Even though the Theil statistics indicate more accurate forecasts of the naive model for USDDEM over a horizon of 3 days, this does not prove significant using the Diebold-Mariano statistics.
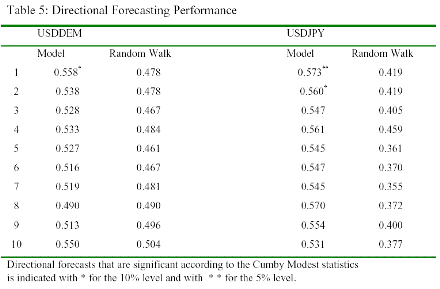
The USDDEM model outperforms the random walk forecast in a time horizon of more than 4 days, however, since the Theil statistics are again not significant, these results should only be taken as indicative. Table 5 reports the proportion of exchange rate changes for which the model gets the direction of change correct. The USDDEM model clearly outperforms the forecast based on a random walk with drift. The USDDEM model gets the direction right in all but one case, with percentages lying between 51.3% and 55.8%. The one-day ahead forecast is significant at the 10% level according to the Cumby- Modest statistics.
This indicates that a forecast based on a model derived from considerations common to Technical Analysis is able to outperform a random walk on a time horizon as short as a day. The declining forecasting ability over time of the Technical Analysis models seems to be consistent with the view that Chartists tend to revise their forecasts on a daily basis. It also corresponds to the relative importance given to Technical Analysis as a means of forecasting by respondents in a survey of the London foreign exchange market by Talyor and Allan (1994).
According to Taylor and Allan, Chart Analysis appears to exercise its greatest influence when market participants are formulating forecasts or trading decisions for the short-term horizon. Around 90% of their respondents reported using Technical Analysis in a time span of less than one week, while the weight given to Technical Analysis in the longer term sharply declines in favour of Fundamental Analysis23 .


The results for USDJPY, also reported in Table 4 and 5, are even more encouraging. The Theil statistics indicate a more accurate forecast performance of the USDJPY model over the random walk alternative for all time horizons: however, only the Theil statistics for the 3, 4 and 5 day ahead forecast are significant according to the Diebold-Mariano procedure.
The USDJPY model also shows good directional forecasting ability, correctly predicting the direction of change between 53.1% and 57.3% over all time horizons. Again, as for USDDEM, the one-day ahead forecast yields the best result with a 57.3% strike, which is significant at the 5% level according to the Cumby-Modest statistics24. It is interesting to compare the forecasting performance of the two empirically identified cointegration vectors to the non-identified cointegration vectors, since restricting the cointegration space changes the short-run dynamics of the system25.
Considering the fact that exactly identifying cointegration vectors entail more restrictions on the cointegration space than just simply determining the cointegration rank, one would expect that a forecasting model based on non-identified cointegration vectors is less robust to changes and hence is more affected if the exchange rate has different features during the estimation period as in an out-of sample forecasting period. This is the case in our forecasting experiment where the beginning of the out-of sample forecasting period coincides with a change in the long-term trend of the dollar.
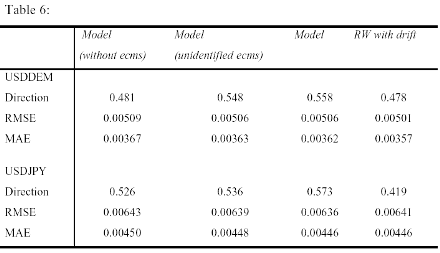
Table 6 shows that the identified cointegration vectors yield the better forecasts for USDDEM as well as USDJPY. The model based on the non-identified cointegration relationships still gets the direction right in more than 50% of all cases and clearly does better than the model without error correction parts. However, it cannot match the results of the identified cointegration vectors.
According to both test statistics of directional forecasting, it can clearly be seen that only the models with the identified ecms are able to significicantly outperform the random walk. These results are encouraging since the good out-of sample performance of these models might also persist in an out-of sample experiment that does not directly succeed the in-sample estimation period.

By relaxing the independence assumption of subsequent returns of the Hendriksson-Merton (1981) test, the Cumby-Modest statistics evaluate the probability of profitable directional forecasts rather than the probability of correct directional forecasts. The Cumby-Modest statistics take not only the sign, but also the amplitude of the forecasting signal into consideration.
A forecasting signal that is significant according to these statistics should, on average, predict large enough changes in the exchange rate that allow the accommodation of transaction costs and risk premia. In the last section of this paper we therefore present a profitability analysis of our forecasting models.
22Since the random walk model with drift had a bigger RMSE than the driftless random walk over all time horizons, it was decided to use the latter as a benchmark for our model forecasts.
23 However, Menkhoff (1995) fails to reproduce the same results in a survey of the German Foreign exchange market. The number of respondents relying on Technical Analysis in a time horizon of less than a week (40%) lies far below the figure quoted by Taylor and Allan. Menkhoff also fails to find evidence that the weight given to technical analysis when formulating trading decisions is declining over time. Only from a time horizon of 6 month onwards does fundamental analysis gain the upperhand. Menkhoff claims that the discrepancy between the two surveys could be partly due to the fact that his respondents could allocate their preferences between three alternatives (Flow Analysis, Technical Analysis and Fundamental Analysis) and not just between two (Technical Analysis and Fundamental Analysis) as in the Taylor and Allan survey, where respondents might have classified Flow analysis as a form of Technical analysis. However, the discrepancy between the two surveys could also indicate a difference in the market microstructure of the London and Frankfurt foreign exchange market.
24 While the directional forecasts of model 3 are with exception of the 2 and 5 day ahead forecasts, all significant according to the test statistics proposed by Dacorogna et al., only the one day ahead forecast is significant according to the Cumby-Modest statistics. Since not correcting the Cumby- Modest statistics for serial correlation yielded that same results as the test proposed by Dacorogna et al. , the importance of correcting for serial correlation can clearly be seen. 25 FIML estimation of the system containing the non-identified cointegration vectors is not given here, since the same set of linear equation, even though with slightly different coefficients, was found for both pairs of cointegration vectors. The coefficients for the two pairs of the error correction parts varied slightly as expected.
Prof. Ronald MacDonald, Prof. Norbert Fiess
Next: Assessing the profitability of the forecasting models
Summary: Index