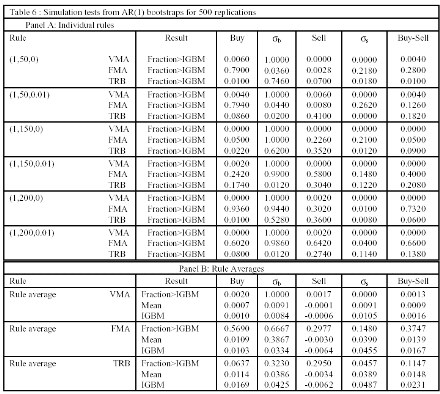
In Table 6 we display the results for a simulated AR(1) process by using the estimated residuals from the original series for the entire sample. This experiment is designed to detect whether the results from the trading rules could be caused by daily serial correlation in the series, since results reported in Table 1 document a significant first order autocorrelation in the IGBM series. The numbers presented in Panel A are the fractions of the 500 simulations that result in larger statistics than those for the observed IGBM series.
These statistics include, as in Tables 2-4, the mean buy, mean sell, and mean buy-sell difference returns, and the conditional standard deviations σb and σs defined above. For example, for the VMA(1,50,0) rule, Table 6 shows that, for the period 4/1/66 to 15/10/97, 0.6 percent of the simulated series generated a mean buy return as large as that form the actual IGBM series. This can be thought of as a simulated "p-value".
On the other hand, all of the simulated series generated a mean sell returns larger than the IGBM mean sell return, while only 0.4 percent of the simulated series generated mean buy-sell differences larger than the mean difference for the IGBM. The σb and σs entries show that every simulated buy conditional standard deviation exceeded that of the analogous IGBM standard deviation, whereas none of the simulated sell standard deviations was larger than the corresponding value from the observed series.
While the results for the returns are consistent with the traditional tests presented in the corresponding Table 2, the results for the standard deviations are new. As can be seen, the buy signals pick out periods where higher conditional means are accompanied by lower volatilities. These findings are similar to those found for the Dow Jones Index in the United States by BLL (1992), who emphasised that these are not in accord with any argument that explains return predictability in terms of changing risk.

Almost identical results are found for all the other VMA rules, while the TRB rules produce similar, if not quite as conclusive, findings [except for the (1,150,0.01) and (1,200, 0.01) cases]. Finally, for the FMA rule, the results show a slightly different picture since a higher proportion (79 percent) of the simulated series generated a mean buy return as large as that form the actual IGBM series following a FMA(1,50) rule (both with and without the one percent band), while only 0.04 percent of simulated buy conditional standard deviation exceeded that of the analogous IGBM standard deviation.
As a result, 28 percent (13 percent) of the simulated series generated mean buy-sell differences larger than the mean difference for the IGBM, when the one percent band is not (is) considered. Similarly, for the FMA(1,200) rule, 94 percent of the simulated series generated a mean buy return as large as that form the actual IGBM series, while 73 percent of the simulated series generated mean buy-sell differences larger than the mean difference for the IGBM. The introduction of the one percent band reduces this percentages to 60 percent and 66 percent, respectively.
In Panel B of Table 6 the results are summarized across all the rules. An average is taken for the statistics generated from each of the six rules. For the mean buys this would be
mb = 1/6[mb (1,50,0)] + 1/6[mb (1,50,0.01)] + 1/6[mb (1,150,0)]
+ 1/6[mb (1,150,0.01)] + 1/6[mb (1,200,0)] + 1/6[mb (1,200,0.01)]
The results presented in the first row of Panel B (Fraction>IGBM), which follows the same format as Panel A, strongly agree with those for the individual rules. The second row (Mean) shows the returns and standard deviations of the buys, sells, and buy-sells, averaged over the 500 simulated AR(1) processes, and the third row (IGBM) shows the same statistics for the original IGBM series. As can be seen, the simulated buy mean returns in the column "Buy" are lower than the actual mean returns for the VMA and TRB rules.
However, this difference is not significant as indicated by the "p-value" of 0.002 and 0.0637, respectively. In contrast, for the FMA rule, the opposite occurs, being the difference significant with a "p-value" of 0.569. On the other hand, for all three rules, the simulated sell mean returns are less negative than the actual sell mean returns, being the difference highly significant. Finally, the simulated buy-sell spreads are lower than the actual spread for all three rules, being the difference more significant for the FMA case. These results suggest that the simple serial correlation implied by the AR(1) model cannot explain the trading profits.
By F. Fernández, S. Sosvilla and J. Andrada
Next: GARCH/GARCH M Process
Summary: Index