A. Characteristic Analysis of Profiting Utility Curve
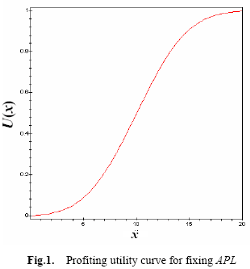
Let µ=10 (APL), and σ=3.8(standard variance of APL), corresponding curve of satisfying utility is drown in Fig.1. In Fig.1, RL is in a losing when xε[0, 10), and RL is in an accrual when xε[10, 20]. We see, the utility curve is a curve of the letter “S” form, and there is an inflexion on the curve. The curve is concave in the profiting field, and is protruding in the losing field. And the curve's gradient is steeper in the losing field than in the profiting field. This result is consistent with Kahneman’s “unreasonable investor” theory [2].
B. Characteristic Analysis of relations between APL and Profiting Utility

In practice, the higher APL µ is, the less the profiting utility is, i.e. the more the desponding utility is. This Standpoint can be validated by the following analysis.
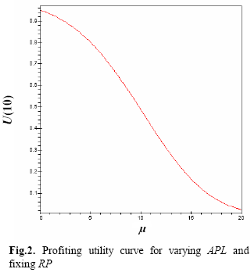
1) If RL x=10, σ=5.2, according to (6), the profiting utility will varies from high to low along with APL from small to large, this varying process is shown in Fig.2. And in Fig.2, the profiting utility is gradually down when the APL becomes larger and larger.

2) Again if σ=5.2, µ(APL) and x (RL) each vary independently from 0 to 20, then the profiting utility will vary correspondingly, this process is shown in Fig.3. Therefore, the relation between prospect behavior and profiting utility reflected by PD-utility function match the actual circumstance in the basic characteristics. The related analysis about losing utility is similar to the profiting utility, and no longer describe here.
Prof. Feng Dai, Prof. Song-tao Wu, Prof. Ya-jun Zhuang
Next: Comparison Analysis between losing and profiting utility
Summary: Index