Equation (10) gives us a practical tool to construct an optimal trading strategy. Taking into consideration realistic values for α and σ, such as those found in sect. III, one can realize that the y interval with a non trivial l* is very small.
As a consequence, the optimal strategy (10) is de facto almost equivalent to the following more simple suboptimal strategy: invest all the capital (l = 1) whenever αy is positive, keep a neutral position (l = 0) otherwise. This simple trading strategy is applied to our three datasets, using for parameters α, β and σ the corresponding values found in sect. III. The resulting capital growth rates λ(α, β, σ) are compared with the intrinsic growth rates of crude data λcd, which is obtained applying a buy and hold technique:
a) Nasdaq index: λ(α, β, σ) = 1.18 · 10-3 and λcd = 6.76 · 10-4;
b) Mibtel index: λ(α, β, σ) = 9.60 · 10-4 and λcd = 6.80 · 10-4;
c) USD-DM exchange rate: λ(α, β, σ) = 3.42 · 10-5 and λcd = −4.74 · 10-8.
In the last case, we have used the parameters resulting from the fit in the range 8 ≤ T ≤ 150. For comparison with the previous two cases concerning indices, we have chosen to buy only dollars (the asset) against marks (money), while the opposite operation is not admitted.
The λcd turns out to be negative since dollar devalued during 1998. The complete strategy should also allow to buy marks against dollars. This strategy is about twice more successful than our, but it loses its analogy with the one we use in share markets.
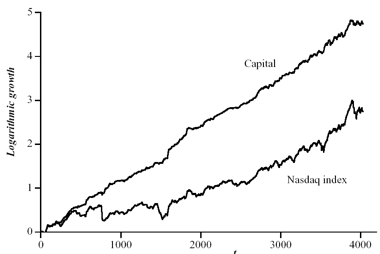
In order to give further evidences of the good quality of the proposed strategy, we consider the logarithmic growth ln (W(t)/W(0)) of a capital invested according to our strategy on the Nasdaq index. This simple strategy widely overcomes the index itself, as shown in fig. 4 where the logarithmic growth of the Nasdaq index is also plotted for comparison. At the end of September 2000, while the Nasdaq index is less than 16 times its initial value, the capital is become about 115 times.
In other terms, the applied strategy is able to forecast the next quote with a probability of success greater than 0.5. Another main feature of our strategy is revealed in fig. 4, where the logarithmic scale allows to compare directly the relative fluctuations of the capital and of the Nasdaq index. It is quite clear that the typical fluctuation of the capital is smaller than that of the Nasdaq index. In particular, the impact of Nasdaq crashes on the capital is smoothened out.

FIG. 4. Logarithmic growth ln (W(t)/W(0)) of a capital W(t) invested on the Nasdaq index as a function of time t, compared with the logarithmic growth of the index itself.
The above results clearly prove a certain degree of inefficiency in the markets under consideration, since there exists at least a deterministic procedure to make a sure profit on a long run. A very interesting question is to determine how much of this information, not integrated by markets, keeps available for speculators once transactions cost are taken into account. Roughly speaking, we find a daily growth rate of about 0.1% with the strategies involving indices where trading frequency is less than an operation per day. It follows that a capital of about ten thousands of dollars should produce profit in case of fixed transaction costs of the order of few dollars per trade. These conditions are quite realistic both in american and european markets.
By Prof. R. Baviera, Prof. M. Pasquini, Prof. J. Raboanary and Prof. M. Serva
Next: Conclusions and References
Summary: Index