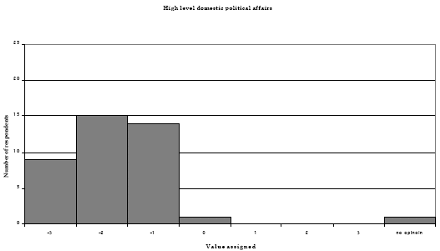
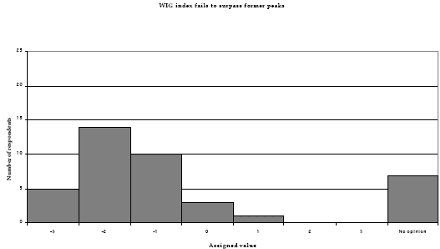
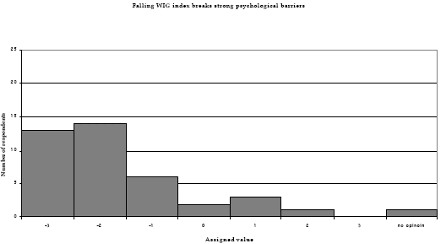
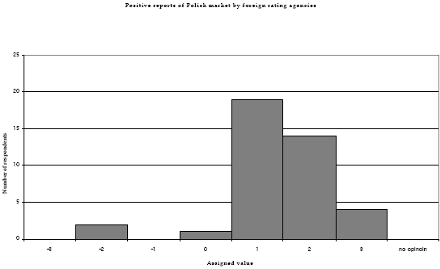
Below 5 examples of histograms showing the distribution of scores are presented. It can be seen that the great majority of the participants were unanimous about what impact a particular measure has on the future stock prices. Demographic features of the participants did not correlate in any way with their responses.


Fig. 2 Histograms of the values assigned to 4 items of the questionnaire. The participants were asked to mark a score –3, -2, -1, 0, +1, +2 or +3 to each item, depending on how they estimated an impact of the item on the future behavior of stock prices (WIG index).


Technical analysis signals
As the second 10-item part of the questionnaire (devoted exclusively to techical analysis signals) show, the participants regard most general technical signals as valid for market movements predictions. More than 60% of the respondents market the following technical signals as having the predictive value: MACD, RSI, Ultimate, ROC, Elliott waves and Fibonacci proporsions.
Prof. Piotr Zielonka
Next: Discussion
Summary: Index