Table 1: Descriptive statistics of the number of quotes per 5-minute interval of the first sample of banks for the period May 14 to September 10, 2001
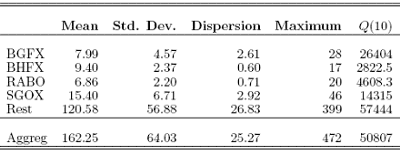
Table 2: Descriptive statistics of the number of quotes per 5-minute interval for the second sample of banks for the period August 24 to October 26 2001
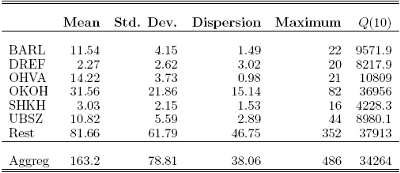
Table 3: News categories
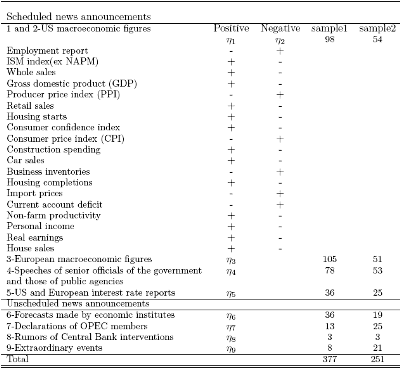
The events are the news headlines released on the Reuters money news-alerts. For US macroeconomig figures, we separate positive and negative news-alerts by comparing the expected and the announced numbers. If the actual numbers are larger than the expectations for economic variables that contribute to economic growth, the announcements are classified as positive (+). If the actual news release means more inflation or a forthcoming economic slowdown, it is classified as a negative news announcement (-).
The expected values are given on Reuters screens a few days before the news announcements. The employment report includes the unemployment figures. ISM is the abbreviation for the Institute of Supply Management, ex NAPM, National Association of Purchasing Management. It is a monthly composite index and gives the earliest indication of the health of the manufacturing sector. The symbol ηj is the coefficient of the dummy variable dj in the equations reported in Tables 6 and 7.
Table 4: Correlation matrix of the q estimated by the MDACP model related to the first sample of banks for the period May 14 to September 10, 2001
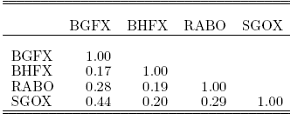
The table presents the correlation matrix q, based on the probability integral transformation z, of the continued count data under the marginal densities estimated using the MDACP models by the two-step procedure (see section 4.1). It shows the contemporeneous correlations of the aggregate system of table 6.
Table 5: Correlation matrix of the q estimated by the MDACP model related to the first sample of banks for the period August 24 to October 26, 2001
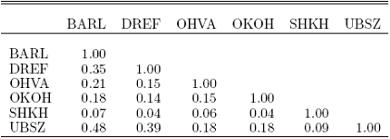
The table presents the correlation matrix q, based on the probability integral transformation z, of the continued count data under the marginal densities estimated using the MDACP models by the two-step procedure (see section 4.1). It shows the contemporeneous correlations of the aggregate system of table 7.
Table 6: Estimation results of MDACP models for sample 1, May 14 to September 10, 2001.
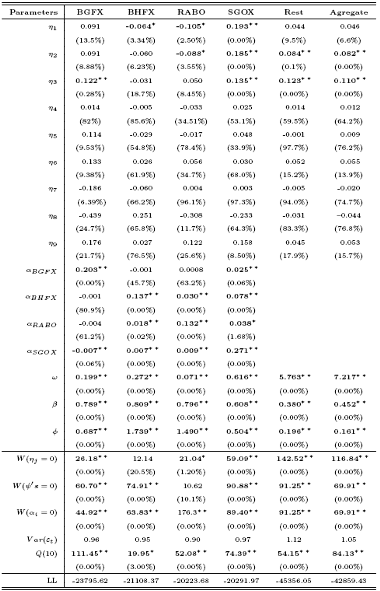

Table 7: Estimation results of MDACP models for sample 2, August 24 to October 26, 2001.
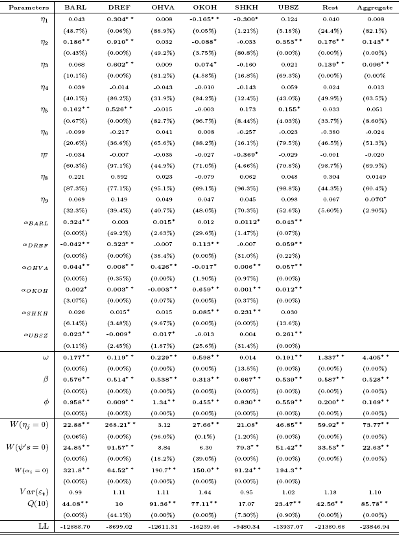
See legends of Table 1
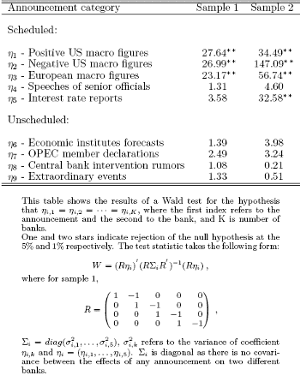
Table 8: Wald tests of equality for all banks of the effect of news
By Dr W. B. Omrane and A. Heinen
Next: Figure
Summary: Index