Uptrends

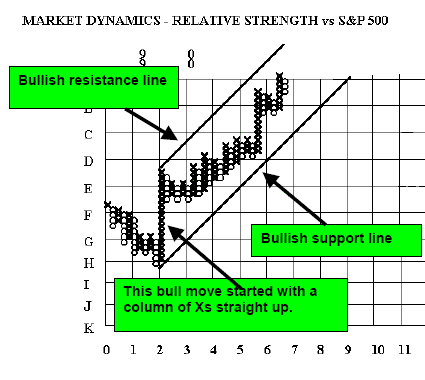
This two-year uptrend has been characterized by a more or less consistent pattern of higher highs and higher lows. Stocks are usually not this consistent and will show more periods of correction.
Downtrends

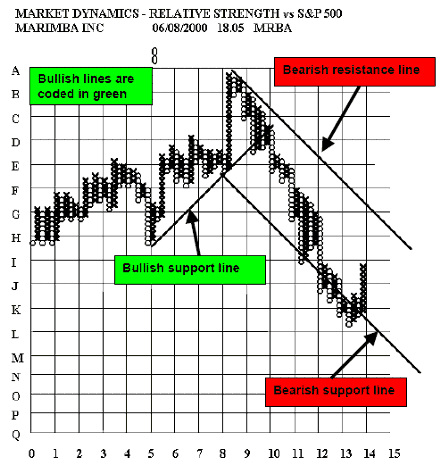
From the peak at (A,8) the stock just started going down and fell for over 25 columns without a single high rising above a prior high. Lower lows and lower highs are the hallmark of a serious downtrend.
Signal patterns

By W. Clay Allen CFA
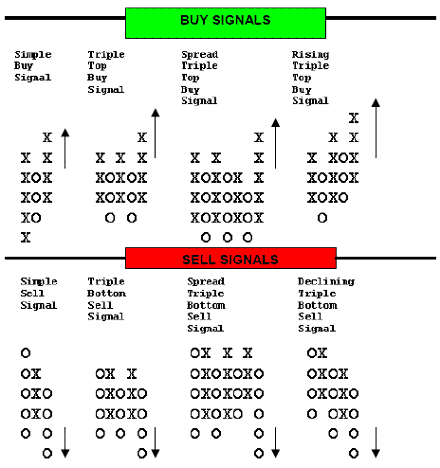
Next: Triple top buy signal - example #1 - There are many examples of triple top buy signals on the chart.
Summary: Index