example 1

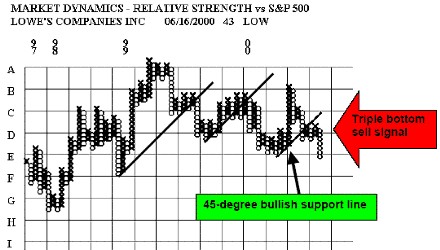
The 45-degree bullish support line has failed and a triple bottom sell signal has been registered. This stock seems to be in a prolonged downside slide – nothing dramatic but significant nonetheless. It should be noted that previous support has been violated which is an additional negative input. Repeated bullish support line failures have been recorded which adds to the downside evidence.
example 2

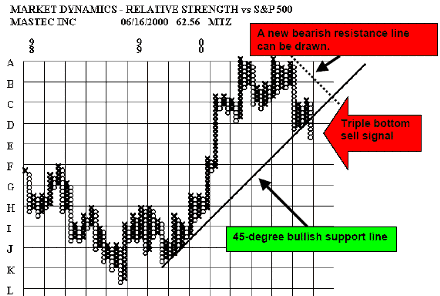
The triple bottom sell signal is shown in the example. It should usually be used with a penetration of the bullish support line. A sell signal after a major bull market move should be given more weight than a signal that is registered after a long decline.
This example shows both a triple bottom sell signal and a bullish support line violation. A downward sloping bearish resistance line could now be drawn from the top at (A, 13).
By W. Clay Allen CFA
Next: 45 degree lines- Bullish
Summary: Index