AO Gann Eights Time (P) and (T): This indicator will show the time projections in eights from the last peak or trough on price for specified sensitivity. The interpretation for the time projections is the same as mentioned previously, when the gray bars touch the red lines, it is a potential trend reversal. Like most time indicators in the price pane, it must be set to display as a histogram without scale. The (T) being in the duration- time pane must be tied to the duration scale.
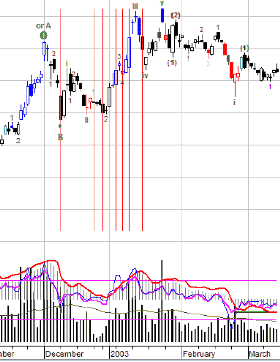

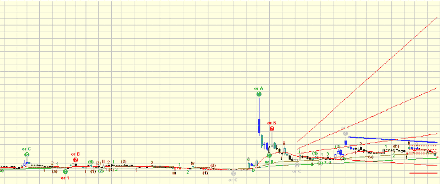
AO Gann Fan at Date: Will plot a Gann fan from the date specified for the selected sensitivity.
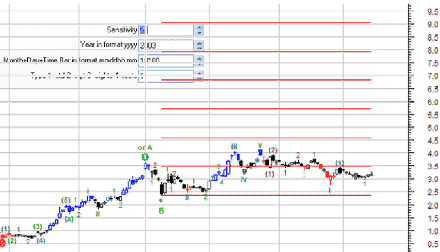
AO Gann Range: This indicator will plot the Gann range in eights for the specified date of the peak or trough of specified sensitivity. The types are shown on the chart below. Note that the displayed settings do not correspond to the displayed chart.
AO Gann Res& Sup: This indicator will plot the resistance and support in Gann levels for the specified date and sensitivity. You can also select the number of lines to display and the type as shown in chart.
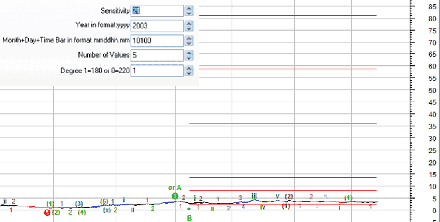
AO Gann Sqr @ degrees: This indicator will plot the price levels for Gann squares and degrees from the date of the peak or trough of specified sensitivity. You can select the type of projection like 45 degrees, square etc…
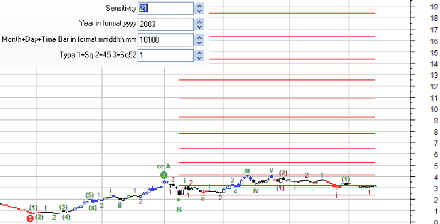
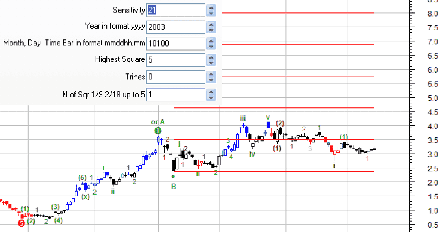
AO Gann Squares: This indicator will plot Gann squares from the date of the peak or trough of specified sensitivity. There are quite a few adjusting parameters to display the type of Gann squares you like. To use this indicator, you should read about the Gann geometry of price. The mathematics behind are simple but the application is far more complex. Feeling your way by testing will at least provide the satisfaction of discovering relationships between price and Gann geometry. Note that Gann always started from the lowest historical low to build up the projections.
Next: Appendix 8
Summary: Index