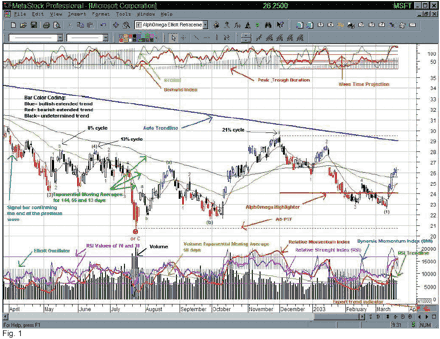
To jump right in and get a head start, drag your cursor in the price pane, right click on an empty portion, select Apply Template and choose AlphOmega Simple, apply and close the dialog box. The screen should look like this after a few seconds…

Template AlphOmega Simple
This screenshot is your basic Elliott wave screen with this set. Arrows point to all the indicators that are included in the template. The Expert is producing the wave count labels you see for each cycle (8, 13, 21 and 34%). Note that the label appears at the end of a wave. When several waves from a different cycle end at the same bar, the largest cycle has priority over the lesser ones; its label will be superposed over the others making them invisible. Since the larger cycle needs more retracement to be confirmed, the labels of the other cycles will show until then.
Retracement is a word that we must explain before going any further. To know that we have reached the end of a wave (and the beginning of the next), the price must reverse direction and retrace a portion of the distance (difference between peak and trough) covered during the wave deployment. The importance of the distance and that of the retracement will determine the cycle of the wave.
This puts a lot of emphasis on the threshold of retracement for a specific cycle, retracement being measured in percent (distance retraced over distance traveled during the wave). The threshold we name Trigger and the Expert can color the bar on which the trigger is crossed for a specific cycle. To this end, the Expert must be edited, using the password, go the Highlights tab and check the box for the selected cycle; the default value is set to uncheck for all but the 21% cycle. This trigger can be a signal for entering or exiting a position.
The Elliott oscillator is the next indicator of importance in your chart. It is the difference between a 5 and 35 day moving average of the High or the Low (depending on the trend). We use it to differentiate between a third wave and a fifth wave as you will find out later in this manual. The RSI and the STORSI are used to time entry or exit but not to pick a top or a bottom of market. The Demand Index is better at picking top or bottom of market because it incorporates volume in its calculation. Do not be concerned if you do not understand everything at this point, we will discuss in more details each part of the screen.
Next: Terminology
Summary: Index