As explained earlier, there are four orders of sensitivity or cycles. All these sensitivities are nested so the smaller order starts counting from one at the beginning of a next higher order. There is one exception, which is when there has been a wave 5; it is usually followed by an ABC or ABCDE correction that spans the next order of sensitivity. From version 5.5, the price projection takes in account a wave 3 shorter than wave 1 and followed by an extension of the 3. In this case the projection includes the combination of the 2 parts of wave 3.
These flawed waves 3 are displayed in gray on your chart. For all price and time projection indicators that are used in the AlphOmega Simple template, there are corresponding indicators to be used in the AOi Simple template. Actually, the indicators are not template dependant, they could be used wherever we see fit. The templates are synchronized to a main sensitivity and anyone can change it or make a new one for a different sensitivity.
TIP: There is a configurable tool bar from MetaStock® where you can cast your most useful templates. The AlphOmega Simple template should be made the default template if you use regularly Elliott Waves. For those who trade intraday, there is a template AOi Simple that will provide proper settings and expert. Please note that the two experts overlap on the fast wave sensitivity of 8%. This has been done to provide continuity between the intraday picture and the daily or weekly picture. The labelling of the symbols is such that by dropping the mouse over them, you can tell the exact sensitivity it is addressing. The four Experts are similar and only the percentage filter is changed to correspond to the sensitivity to be scanned.
Price Projection from an Unconfirmed Wave

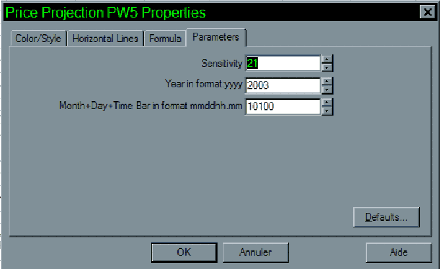
Fig 21
This screen shows the parameters to be used when projecting prices for a wave at a date when we suspect that the previous is completed but not confirmed. When we want a projection for this type, we must select the right indicator (for the appropriate wave number and PW in the name) for the wave in progress and enter the date of the high/low at the base of the wave. Making sure we enter a date at or after the completion of the high or low; failing to do that will enable the display of the previous pattern projections. We must enter the proper sensitivity for the pattern we are studying. Using the Zig Zag function or AO ZZ will greatly facilitate our perception. This projection indicator is recommended when the larger order of sensitivity is still undefined or when a full cycle of waves has not been observed (The automated indicator will always start looking for a C wave or a 5. If these waves are undefined, the indicator will not function and it will not display.

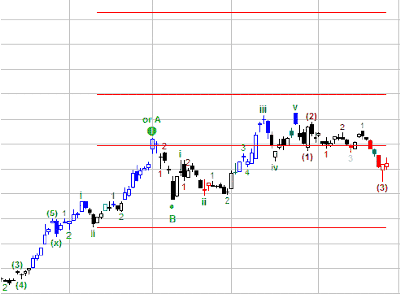
Fig. 22
This price projection shows the point of origin; the lowest red bar and the beginning date (start of red line). The other red lines are the projections based on the Fibonacci relationship between the preceding waves. As a matter of fact, the peak of wave 3 (where the green 1 or A is) took place a shade above the first projection line. The lines will run from the start date to date for look back projection. The display is similar for potential waves or confirmed waves. With the “AO” indicators, we have price projections that are also made from dates and are easy to use.
All we have to do is to point our mouse over the peaks and troughs we want to start the projection from, note the dates and input them in the indicator fields. The date is always the peak or trough from where we want to make the projection. Note that the difference between this indicator and the AlphOmega is in the validation of the pattern made by AlphOmega to apply a full set of projections. The “AO” will make a projection that will have fewer possibilities because it is based only on the previous wave; it ignores the relationship to other waves of the pattern. It is for a fast Fibonacci layout.
Next: Formula Building
Summary: Index