AlphOmega uses 2 styles of price and time projections; both are based of the same Fibonacci golden ratio but they are used in different conditions. The one we have seen so far is the current price or time projection; it is called current because it can only work on the bars since the latest peak or trough of the same sensitivity. As the price moves to a new peak or trough, the projection will be replaced by a fresh one using the new peak or trough. At times, we will need to see how a security has done versus projections in the past; this is the back testing or historical projection. To use that style, we will need to enter a date and time from which we want the projection to be made. Let’s go through an example of each type to understand their use.
Current Projection

Fig 18
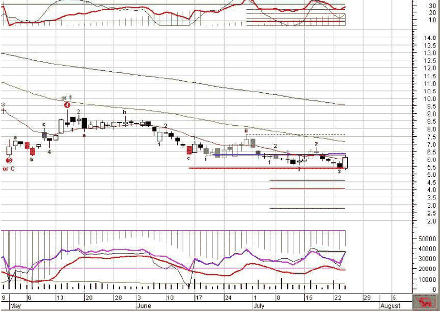
This screen from Agile Software shows the various possibilities for the termination of a wave 3. This screen is generated using the Simple template and adding the Wave Price Projection (21%) indicator to the price window. The Wave Price Projection is available for most sensitivity and these projections are based of Fibonacci ratios; the indicator will only show the projections for a wave termination that fits the definition of the current wave. For an impulse wave, it will not show intra-wave projections meaning prices before the previous peak or trough; for a corrective wave, it will only show intrawave. It will also account for displaced end of wave 3 patterns when the initial wave is too short and the Expert detects an extension of it.
A similar indicator, the AlphOmega Highlighter (thick red line) will narrow the range. It has replaced the Wave Price Projection in the Simple template. This is not to be confused with the AlphOmega Similarity of Wave indicator that is an indicator for waves breaking the similarity pattern at the onset. A third method is used when the preceding wave is not yet confirmed but you suspect it is completed.
The indicator is Price Projection PWx where the P stands for potential and the x for the wave number. Its purpose is to enable a price projection even if the last leg is still dynamic and unconfirmed. It functions as the preceding one; you enter the date of the suspected beginning of the wave to be projected. Since the projections start from the bar date we entered, we will see only dots if the start bar is the last one on the chart; as bars are added, the lines will lengthen and display normally.
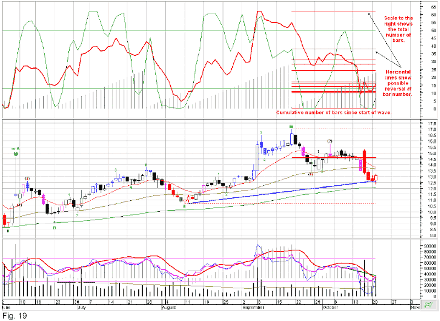
In the top inner window, we can see the Wave Time Projection (21%) for wave iii. This indicator requires more explanations as it deals with bars that will appear in the future and MetaStock® will only display bars for which it has price data. To overcome this problem, we have reversed the time scale; on the price window, the time runs from left to right, each period adding a bar on the right side. In the inner window for time (top of the screen) for each period, we display a vertical bar that grows higher from one bar to the other; the height of the bar represents the total number of bars since the start of the wave (here the wave at 21% sensitivity). Doing this reversal, allows us to display projections at the height corresponding to the different bar numbers we expect the wave to possibly end. See chart below.

Generally time projections are less accurate than price projections so when the two agree (the price is close to a price projection line and the histogram is close to a time projection line), it is a very strong signal that the price is about to reverse. When there is only one of the price or time that nears a projection line, always prefer the price projection to the time projection.
Historical Projection (for back testing)
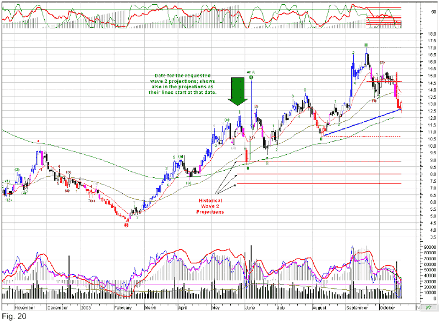
The second type is using Price Projection Wx where x stands for the wave number. Then we will need to enter the date of the beginning of the wave to be projected. This is good for studying how close the relationship with Fibonacci ratios is. The same technique is also used for time projections except that it must be displayed in the top inner window where the appropriate scale shows the number of bars.
As can be seen in the chart below, we wanted a price projection for a wave two that started on May 23, 2003; the date was entered according to the convention mentioned previously, that is 052300 for the Month Day Hour Minute field and 2003 for the year field. The price projections are displayed from the input date to today; going back to the origin of the line will always tell us to which wave it is related to (bar when the wave started). Note how close to the end of wave 2 the first projection is. For this indicator, we must pick the wave number we intend to project and the date of the bar where the wave started.
The Highlighter cannot be used for historical projections nor the PW series since the wave count is already confirmed. When we have a good correlation with historical projections, meaning that the price reversals are very close to one of the projection lines, we can expect this correlation to be maintained during the whole cycle. It is preferable to do this kind of back testing when we see drastic price changes across the time frame we are studying; if the correlation is not really good, it might be better to change the sensitivity to a higher number to find the level that it is responsive. AO ZZ is a very good tool to check how well the waves are caught at significant peaks and troughs.

Next: Special Rules for Applied Fibonacci
Summary: Index