First let’s make sure you have correctly set-up your set of Experts, Indicators, Systems and Explorations. From MetaStock® 7.2 and up, the import is done automatically. Open a chart and right click to select a template. Use the AlphOmega Simple template (Elliott Waves) that should contain in addition to the price and volume data, the following indicators:
- AO P&T Duration in gray and Wave Time Projection for 21% (Normal) in red
- AO STORSI in green and Demand Index in red
- Exponential Moving Averages on Close for 13, 55 and 144 days in green, dark yellow and red
- AlphOmega Elliott Waves NV v6.0 Expert
- AO PTF Indicator set-up for 21% (Normal)* in dotted red lines
- AlphOmega Wave Highlighter (already set-up for 21%) (Normal) in red
- AlphOmega Auto Trendline* for 21% (Normal) in blue
- AO Elliott Oscillator in gray
- AlphOmega RSI/RMI Trend, RSI (Close, 14)* in magenta, Dynamic Momentum Index in blue and Trendline in green and Relative Momentum Index (20, 5)* in red
- Volume Moving Average (50,E) in dark yellow
(Note that an asterisk indicates the indicators that may be verified for proper parameters set-up in the provided template. MetaStock® imports with default set-up but it is rarely a problem.)
The first two are in the top inner window while the last four should be in the Volume inner window. You can choose to have no scale or use a left side scale to protect your volume scale. Your AlphOmega Simple template should look like the graph in Fig. 1 below. The other AlphOmega templates (Elliott Waves (8%), Elliott Waves (13%) and Elliott Waves (34%)) will have all of the above where the 21% is replaced by 8%, 13% and 34%.
If you place an icon at the bottom of your window, the templates are called at will and do not replace your smart charts.
All these templates are included in your set. Please take the time to verify that the correct settings are in place for the indicators with an asterisk otherwise all the templates will show the same Wave depth.
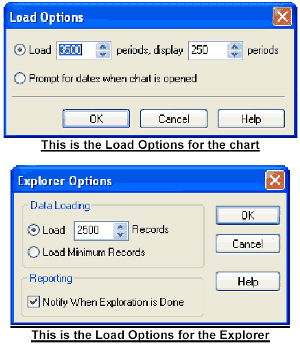
One word before we get in the screens layout, The Explorer™ and the charts should be run with the largest amount of data you have. In the options I have used “Load 3500 records” because the slowest cycle can evolve over many years. Since you must capture one full wave (At least one Peak and one Trough) before The Expert Advisor™ can see it, you must also have a full cycle of waves before you can track accurately wave 5 or A, B and C. The Expert Advisor™ forms an opinion on what is displayed, and so it cannot know that this wave is actually the fifth if it doesn’t see the previous four. The more data you have and the more reliable is the wave count.

If you want coherence between your explorations and your charts, make sure you load the same number of bars in both. Do not do as in the above example!
Initial Data and Unusual Situations
When you are looking at the oldest price data you have for a security (at the beginning time of your chart), you will find that the wave count is undefined. This will lead to strange patterns initially until there is enough data analysed. The long and deep waves are mostly subjected to this problem or a security that is not very volatile. When you are dealing with a very volatile security, you will go through all the cycles very quickly.
Another issue we have to contend with is when the security enters a consolidation period. This means that the price is trading in a narrow range and forming triangular or sideway patterns. When this situation is at hand, failing waves or repeated extensions break up the wave count and the count is erratic.
Next: For a quick start using the AlphOmega Simple template
Summary: Index