All that was said for daily, weekly or monthly charts applies to intraday as well. The difference lies with two aspects:
1) A lower volatility than the other time frames.
2) Hours and minutes added to the timeframe reference.
The lower volatility concerns indices and futures even in daily timeframe, so the intraday set can be used to monitor them. To capture waves in a context of low volatility, we use a lower percentage retracement. We must be careful that the sensitivities used can nest properly into each other; this is accomplished by keeping in stride with the Fibonacci number sequence. Then it is a matter of selecting the expert that is the most appropriate for the selected security.
While we will capture most of the larger timeframes with the daily set, the stronger moves or spurs of volatility will not be captured by the intraday set; to indicate that the expert is not capturing an out of range move, it will display LC (meaning Larger Cycle). When there are many such labels on the chart, we should move to the next expert with higher percentage retracement to make sure that we are not going against a larger trend. To differentiate the intraday set, the letter i is used after the prefix AO or associated with the percent number in the naming of the explorations, indicators, systems and templates. The experts are named according to the volatility they monitor, daily with NV (normal volatility), LV (low volatility), Futures (even lower volatility) and the last one penny stocks with HV (high volatility). What was said earlier about the explorations can also happen with experts, indicators, systems and templates.
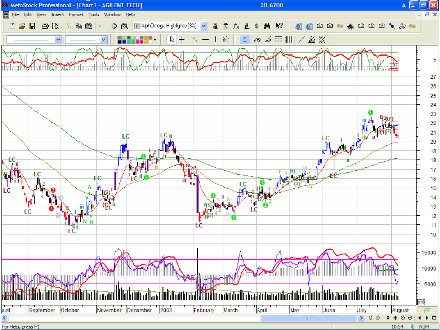
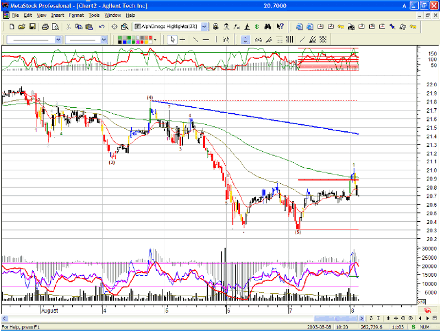
If the chart is filled with too much information (waves, signals, lines) move to a larger % filter (retracement). If we have a look at figure 57, we see the LC all over the screen; the AOi Simple template was applied to a normal volatility stock. The trend lines are too short because they are set for 3% sensitivity as the rest of the indicators. Figure 58 shows the same template applied to an intraday version of the same stock.

Fig 57

Fig 58
The indicators such as the Trendline and the AlphOmega Highlighter are displaying properly. The expert does not display LC and clearly monitors the cycles displayed in the chart. To provide flexibility, all indicators using sensitivity input, have a range from 0.1% to 144%. Keeping that in mind, when we drag in an indicator, let’s make sure we replace the default value of 21% by the desired percentage. If we change a formula, know that the templates that use the formula will be reset to the default value as we save our indicator; it is necessary to resave the template with the chosen percentage.
Indicators that require a date input must have the hour and minute specified to display properly on an intraday chart. Note that the standard Elliott Indicators like STORSI, Elliott oscillator and the RSI have the same default values in their setup and are used as is in the template. It might be necessary to adapt them to specific market. An RSI at 14 bars could be too slow, just like an Elliott oscillator using the difference between 5 and 35 bar average could be inappropriate. Because it is usually a matter of personal preference, the choice is left to us as to the sensitivity we want to use with them.
If we always trade the same market, we should change them to the appropriate level, one that we are comfortable with; otherwise we can use them as is but being alerted that tuning will be needed at times. When we are using AOi Simple on an intraday chart, we will get a slow down of the screen display. The size of the expert and the use of many indicators will consume a lot of the available memory both graphic and RAM as well as CPU capacity. Going to a larger timeframe, like 2 minute to 5 minute, will improve the situation as MetaStock will recalculate a bit less.
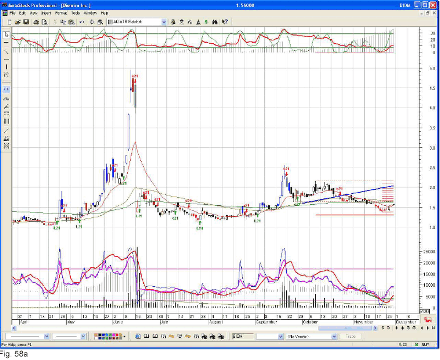
Performance is a matter of available RAM, graphic card and processor speed as well as data line speed. The next screenshot is about a new expert that attempts to circumvent the screen slowdown. By displaying less information you use less system resource. A good way of using this expert is to combine it with the regular wave count expert. You first look at the wave count at the daily level, then the interval you normally trade i.e 10 minute bars; then you apply the impulse expert and monitor your trade with the arrows produced by the later expert. If the situation becomes confused, switch back to the wave count expert to reassess the pattern.

This screenshot is the AlphOmega Elliott Waves Impulse Signals which purpose is to give timely signals to the trader. While we presented it earlier, the way to use it differs from the other experts. The symbol for each sensitivity must be turned on or off depending on the monitored wave. To leave them all on would overload your chart and their priority ranking would overwrite some signals. The same can be said for long trades versus short trades; if both are displayed, you will eventually miss an exit signal as the entry signal, that has a higher priority than the exit, will crush it.
The arrows will show once the price retracement is equal to the sensitivity selected. Once an arrow is displayed, it is not affected by the newer bar information; for each entry, you will have an exit. The commentary will assist you in selecting the right price projection indicator for your target assessment. The trend indicator and the corner indicator will provide the same information as the normal volatility expert. The symbols used are more explicit and they provide sensitivity level. The symbols are:
Long entry: L21
Long exit: x21
Short entry: s21
Short exit: c21
The 21 refers to the sensitivity level (21%) and it varies according to the symbols you have selected.
Next: Special Display for Special Situation - Waves
Summary: Index