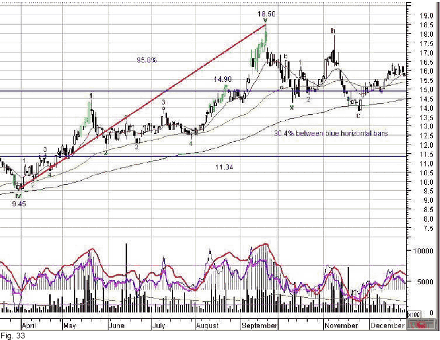
What is the real profit potential we can expect from a wave? How accurate and timely is the signal? The wave we will study starts on March 30th 2001 to end on September 21st, 2001. At the time we have recognized the beginning, on April 16th, we plot a red line to the date we know the wave has ended, October 11th, 2001. Why do we have a delay? Simply because the price must travel a certain percentage before the peak or the trough is confirmed.
This is what MetaStock® calls the dynamic portion of the Zig Zag indicator. While many think that the dynamic portion makes the indicator useless, I believe it to be most useful once understood. It provides a confirmation that the trend has indeed reversed and we must sacrifice the price movement needed for the confirmation. The confirmation process has to occur at both ends of the wave, hence the delay between the dates and the signals. The impact on the price is as follows: the trough started at 9.45 and was confirmed when the price was at 11.34 thus a price move up of 21%.
Then the peak occurred at 18.50 but was confirmed only once the price retraced to 14.80 thus another price move down of 21%. While both price moves are of 21%, the base is different. The first base is the trough, so 9.45 plus 21% of 9.45 is 11.34. The second base is the peak of 18.50 and 21% of 18.50 less 18.50 is 14.80. So the price move has to be larger when coming down than going up! Does it leave enough price movement for a profit?

The answer is crucial and explains why many wave traders loose money when using indicators that are not fully understood. The two horizontal blue bars show the profit area included in the wave. Fortunately, this wave is long enough to allow a 30.4% profit after the confirmation signals. The price appreciation between the trough and the peak is 95.8% measured from the trough. The profit percentage is measured from the entry base of 11.34. Although the profit looks pitiful when compared to the wave, it took 122 bars to reap it. If you annualize the rate, it is the equivalent of 59.8% on a trading year of 240 bars.
Can we improve the profit zone by improving the confirmation signals? To ignore the confirmation signal means that we don't know if the wave has really started or ended. The risk is that if it hasn't really started, the price could head in a different direction. At the other end, the price could continue its trend after we have exited. There are tools like Fibonacci and Gann projections to help you evaluate if a peak or trough has been reached. Other indicators such as momentum or trend will also provide valuable information; they are not reliable in every market. If we do not want to compromise on the confirmation signals, is it possible to know which waves will yield enough potential to provide a reasonable profit? There is no absolute knowledge; however there is a necessary condition, always trade with the market trend! Waves that take off too quickly can falter early. Back testing with the security will show typical potential. Good wave identification is a solid foundation. This is the area where personal experience will lead over concepts.
Note that this is the most conservative way of trading the waves and that it excludes using price and time projections to anticipate the reversal. There are many tools to get earlier signals with various risk levels. At times we may not want to ride the whole wave but just a quick profit, this entails that we are out of the trade when the price has reached a predetermined target.
However most of the time, we worked hard enough to make the selection so we want the most of it. In a recent article, I read that after years of compiling the gain from different systems, the single system that outdid all of the rest, was a cross of moving averages. When we think of it, it makes a lot of sense; the delay caused by the slow reaction of the longest average is akin to the wave confirmation. This is a reason why we like to use exponential moving averages with Elliott waves. They provide a view over different time frames as we vary their length; the same is true about Elliott waves when we look at 4 different sensitivities. Trend lines, support and resistance are very similar in their application to a chart; their main difference is the number of points required to compute them.
The points are extremes and the path in between is not accounted for; this is a plus for using them in tandem with the MA because they are more sensitive to a sudden volatility change than the MA that will average down the surge. The combination of several of these tools will help us pre-empting the confirmation signal to increase the gain potential of a wave. By the same token our risk will also be higher so we need to use a stop loss to prevent a large loss from a counter projection move. It means closer monitoring of our trades and a good discipline to stick to the original plan and dump the trade when it heads the wrong way (even if we believe it will come back on stream)
Next: Incidence of a cycle over a smaller one
Summary: Index