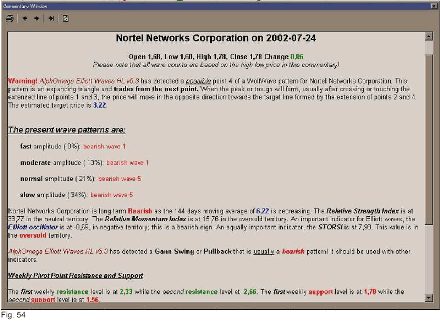
The Expert is activated from the menu by attaching it to a template or a chart. It is the code that will generate our labels for waves, color the bars according to set conditions, display a commentary as in Fig. 54.The commentary will be adapted to the latest price bar in the active chart. It is a part of the AlphOmega templates. These commentaries are not a substitute for due diligence on the selected security but provide basic information for the specific pattern being detected.
If no special pattern is detected, you will nevertheless read about the common indicators such as RSI and RMI or STORSI. The waves for all related sensitivities will be posted. For special patterns such as Inside Day/Narrow Range or a new wave being confirmed, we will see an appropriate commentary disclosing the pattern and its meaning. These will appear only when the conditions are met. It is possible to see the commentary for an older bar by moving to the left, the commentary pointer (upside down black triangle). There are four Experts we can use. The first one is the normal volatility for normal stocks and is loaded when we call the AlphOmega Simple template.
If the security we are watching is of low volatility, indices or intraday quotes, we will select the low volatility Expert that is loaded normally with the AlphOmega iSimple template. With this later template, we will have the adapted indicators (Usually “i” indicators) that will monitor properly the prices. When volatility picks up we can switch back to the normal volatility one. To provide some continuity between the two Experts, a common cycle is monitored so we can find the same wave numbers from one Expert to the other with that sensitivity. The highest sensitivity for the low volatility Expert is the lowest sensitivity for the daily Expert. Below is a screenshot of the daily Expert.

In the course of time, many analytical comments were added to this expert. The difficulty resides in keeping the essential and to not overload it with trivial observations. Your comments in that respect will be welcome. The real force of these commentaries is to remind the user about things he already knows but will overlook in the frenzy of the action. It also serves as an educational tool for the beginner or occasional analyst. It helps bringing back the focus to the overall picture; not only the Elliott Wave or the opportunity for a quick gain. Another feature of this Expert is the alert it can generate when the special patterns are encountered.
This alert will let us know it’s specific and to consult the Expert Commentary for further information. So as we rotate through our securities, these alerts will pop up to warn us. Since it could easily become a nuisance to have alerts pop up continually, the alert can be disabled from the Expert dialog. In addition, they have been set only for significant patterns, not for wave confirmation or other things you can view easily from the chart. The third expert is for high volatility and is identical to normal volatility but for the addition of a very high sensitivity and the modification of the labels to integrate the added information.
The last expert is for futures or commodities, its sensitivity is very low (always referring to the percent retracement, not its ability to pick up a signal) at 0.3%. The four Experts are almost identical except for the range of sensitivities covered. The second Expert is used for low volatility situations such as indices where a price movement expressed in percentage can be very small. The third for very high volatility like penny stocks and the last as mentioned for futures and commodities.
Highlights

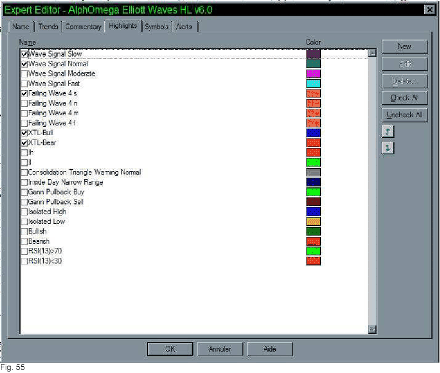
The highlights are used to color bars according to specific criteria met at that time. They can be used as a signal for entry or exit, indicate a specific market condition and much other information. It is a visual way of displaying information automatically as certain preset conditions are met. The AlphOmega Expert is using a limited number of highlights because the emphasis was put on symbols and highlights should be reserved to situations that you will monitor on an on and off basis.
Make sure that you turn on the feature you want to see by checking the box beside the feature name. Turn them off by removing the checkmark, just click on it. You don’t need the password to do this. Fig. 55 is a screenshot of the Highlights tab within the expert. By checking the appropriate box, we can personalize the display. We can change the color of individual highlights. We must be careful that we do not overload our chart with colors. They are good signals as long as we can remember their significance. Certain highlights names come in different sensitivities that are indicated as (8%) f, (13%) m, (21%) n and (34%) s or fast, moderate, normal and slow. Note that the order in which the highlights are listed is important; the wave signals should always have precedence over other indicators. If two highlights are activated during the same bar, only the first one in the list will be displayed.
The highlights are very important for intraday trading. Their signal is generated as the bar meets the conditions set. It is the first warning we receive and it can make the difference between profit and loss or anticipating and reacting. A tool that is equivalent to highlights is the expert alert that is also triggered at a bar meeting the conditions set. The use of both should greatly enhance our day trading.

Fig. 56
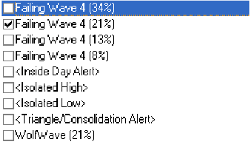
Above is a list of the alerts available on most experts. As we can see only one alert is activated and it is the failing wave 4. A failing wave 4 has retraced too deeply to be followed by a wave 5. It usually becomes a counter trend wave 1. This prevents us from getting too early in what we could mistake for a wave 5, while it would only be a wave 2 of the counter trend (new trend).
Next: Difference between Intra Day and End of Day
Summary: Index