You will note that until now we have used the zigzag function with its percentage version only. There is a good reason for that. The percentage allows us to deal with all securities without personalization, it does not matter that the price is $2 or $10 because all proportions are kept. The zigzag can also work with points instead of percent, for instance you would look at a 3 points change rather than a 3%. However a 3 points change is quite different for a 10$ versus a $100 security. It means that you would need to adapt your points to each security to catch properly the waves. So far there is only a disadvantage in using points but is there a disadvantage in using percent? Yes and a rather annoying one, the top and the bottom of a wave are two different bases to which your zigzag percent is applied.
This translates in the need for a larger move downwards than upwards for the same percentage. So the trigger for a down wave needs more price move than the trigger up wave. It is not such a big deal when the stock is trending as the proportions must evolve with the price move. But when a stock is consolidating or trading sideways, it could be moving in a corridor that is just the height of the up trigger and too small for the down trigger. The outcome is that the wave pattern has one direction confirmed and not the other thus breaking the sequence of the pattern. It will only be resolved if a larger pattern eventually closes the loop. Let’s look at examples…

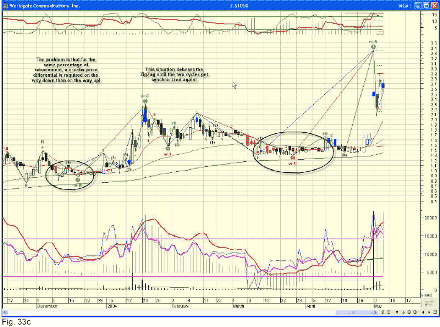
The first example to the left of the chart, shows a down wave i followed by an up wave (1); the i label showed because on the way up after there was enough price movement; the label ii never showed because the price move was only enough to display the lesser sensitivity (1). The consequence is that the pattern ends the big green 1, there are three legs but not one in the same displayed sensitivity; it should have been a i, ii, iii sequence where the last one (iii) would have been replaced by the big green 1. The second example on the right is identical but let’s look at the zigzag lines from AO ZZ.
The blue line is for the 21% sensitivity while the red one is for 34%, the blue line should have gone through the big red 3 but it goes straight to the big green 1 bypassing the peak at the wave (1). Although it is of no consequence, it messes up the display and forces you to look at the next higher sensitivity. When this type of pattern occurs, you can switch to points with the zigzag function. You will find out that although Equis zigzag function allows points, none of the zigzag related functions have a point option. AlphOmega has created High to Low zigzag function and its trigger function so you can use points the same way you use percentage.

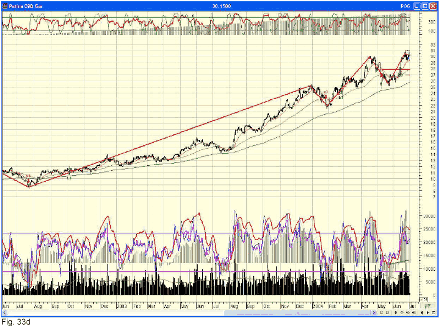
Here is a three point zigzag with an expert that shows the trigger entries and exits, AO Elliott Waves Points. As you can see, it can catch some very nice waves. Yet you must adapt the points to the price level of the security. Because that process cannot be automated with MetaStock ® present code, you will need to system test the optimum points for each price range you want to define for your traded securities.
Next: Explorations & Special Exploration
Summary: Index