Sometimes you will see a pattern where it seems for example that a correction is taking place for the 13% sensitivity. You will be tempted to estimate the reversal point to jump in the next 13% impulse. Before you do that, check that the previous impulse was only a confirmed 13%, in other words not an unconfirmed 21% that has not yet retraced enough. It is good practise to know all the triggers that could become confirmed by the end of the correction. Let’s say the price was $10 at the foot of a bullish impulse, it climbs to $14 to then drop to $12.14. At this point you have a confirmed 13% impulse wave because the price has retraced a bit more than 13% from $14.
In fact it could move sideways for a time so you would believe that another impulse of 13% is building up; then the price could drop again by $2 triggering a confirmation of a 21% wave for the previous impulse. This correction is not finished yet and you are in a trade that is counter trend. Our first assumption was wrong; we should have seen that a $4 impulse is 40% of the initial price, hence there are two sensitivities above our 13%, the 21% and the 34%, that have not been as ended. In such a case, you should wait for the price to climb above the peak of the previous impulse then you will know it is truly a new impulse for the 13% and the continuation of the 21% and 34% impulse.
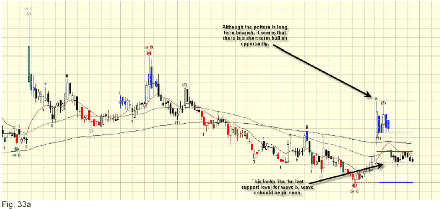
The above mentioned problem will also cause confusing label display. As the higher level wave completes its cycle, its label will crush the lesser wave label thus changing the interpretation of the pattern. This point is so important that a graphical example is necessary. The two charts were taken at 22 days interval and they depict very different patterns, the first is a short term bullish where a long position would yield an interesting profit. The red dotted lines on the right side of the chart show the different support levels for a wave b. If one enters early in the coming wave c the minimum target for profit is the peak at wave a, that is $2.20.
Of course the other indicators are showing that the trend is weakening as we would expect from a correction. There is one puzzling element, the size of the wave a spans well over the 21% trigger and in fact it is enough for a 34% trigger. What should we do? A prudent approach would be to wait for the confirmation of a wave b. An even more conservative attitude would have us wait until price moves above peak a but this would leave us with a reduced profit zone. Look at the first chart…

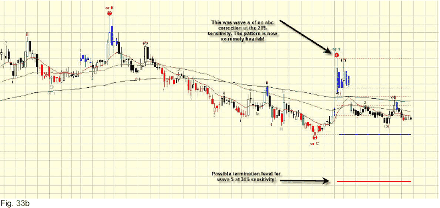
The second chart shows the devastating reality, the pattern is extremely bearish. There will not be a c wave, this pattern is a bearish impulse that will take us below the trough at wave 3 at $1.30. The possible support level for 34% is at $0.75. Could we have seen this before? There was a slim indication that something was cooking, the previous 34% impulse was wrong in that wave 3 was the shortest! This is not acceptable in Elliott Waves. It leaves us with two alternatives, first the wave 3 is incomplete and the wave 4 is a temporary correction that will be followed by the end of the real wave 3, second the wave 3 is in fact a wave c and the bearish correcting pattern will end there. This later alternative will be followed by a consolidation period that could exit either way, up or down. I conclude saying check all triggers before jumping in.

TIP: The AlphOmega Elliott Waves Expert is providing you with a general commentary of the patterns detected on the active chart. It will display the wave patterns for each sensitivity and when a new wave is confirmed for any sensitivity. Please note that the wave count disclosed in the commentary may differ from the one on the screen. This is due to the use of a simplified wave definition in the commentary. It will match the screen 90% of the time but where the volatility is high or a consolidation range is taking place, it will not be able to discard the repeated extensions or the alternation of waves 2
Next: Points versus Percentage
Summary: Index