A word of caution about systems: This feature is there to help us project how our trading system would have performed in the past under the parameters used. We benefit from 100% hindsight. What we should be looking for, is an equity line that is moving steadily up without jerky ups or downs. Even if the system profits from one spectacular trade, it is not good enough. It has to perform on several trades to become acceptable. So when we test different parameters, we don’t go for the one that gives us the highest return on one trade: we go for the one with the most winning trades. There are two types of systems provided with the set. One type addresses all sensitivities; it will tell us how the security behaves within the defined cycles. The second type of system let’s us test the desired sensitivity through the use of the optimization so we can fine tune our analysis or select the order of sensitivity that is the closest to the optimization basis.
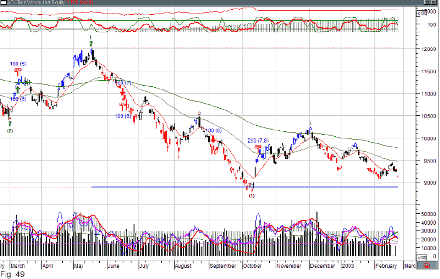
This screen shows the result of a normal Elliott wave’s system test with the buy and the sell arrows. The result may look impressive but the purpose of showing this screen is to demonstrate that there is a lag between the time of entry and the time of exit. This lag accounts for the time and percentage move necessary before the indicator recognizes the wave. With Elliott waves there is always a time lag for confirmation. The trend of the equity line is upward like you would expect of a good trading system. Nevertheless, some securities will never give good results because the volatility span is too small for us to capture any profit. In the system, the commission fees are calculated at 1% in and 1 % out by default.
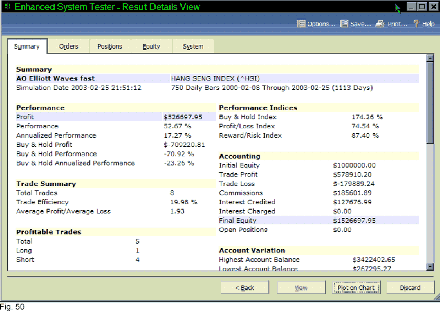
The system uses long and short trades. Below is the report from the Enhanced System Tester. The system has not been optimized but used raw to demonstrate the principle with its flaws. The equity has been raised to 1,000,000 because to trade indices that hover in the 9,000, you need more than 10,000 to buy 100 shares. Of eight trades only five were profitable, one long and four short. The system works in both directions and it is crucial in Elliott methodology.
To bring everything back in perspective with this system, know that if we are in a 21% order of sensitivity, it means that the price must move up or down by at least 21% and then it must change direction and move again at least 21%. For example, this means that if the price goes up 52%, we will know a trough has formed when it crosses the 21% increase in price. We will then know a peak has formed when it goes down by at least 21%. In summary of the 52% upward move, you will take in profit on 10% of the price since it will take 21% going up to know to go in and another 21% to go down to get out. All our systems are based on the Elliott methodology described earlier.
There is no attempt to use a different type of indicator to accelerate the trade signals. The reason for this is to show the naked use of Elliott, where it will give the best results and where it will not perform. As users we have our own predilection for familiar indicators that we can combine in a system and test. Our product is not an automatic profit making system. The risk of loosing money is still very real no matter what technique we use. We should use the system that will ride the waves we are interested in trading. If we are a long term trader, we go for high percentage sensitivity; if we are a day trader, we use an intraday system. All intraday indicators, systems are preceded with an “i” in the sensitivity description. Running a test before making a trade decision will enable us to make sure the security behaves well with the selected sensitivity.
TIP: Let me repeat a way of using the system tester to double-check your analysis of a security. Run the test using the optimizer function. Open the result file and check which value gave the best return i.e. the highest profit or the lowest loss. Then look at the chart using The Expert Advisor™ wave sensitivity that is the closest to the value you just identified. This takes in account the current volatility of the security as well as the historical one. You can observe whether this is a new pattern or if it is a recurring one. It can also indicate that you should not trade such unpredictable security if the return was made on one big transaction instead of several small positive ones. Common sense is always your best counsellor and if you can’t understand what is going on with the price, then you should pass!
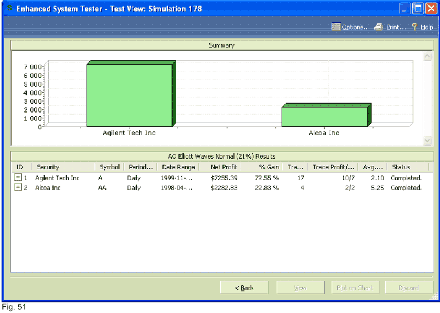
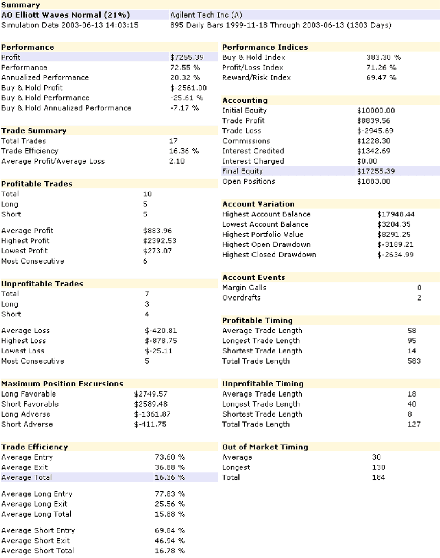
This is a view of AO Elliott Waves Normal (21%) system test on 2 securities. I picked this one to show that even under adverse conditions, it is possible to generate a trading profit. This example tells us that out of 17 trades on Agilent, 10 were profitable and 7 lost money. Yet the overall gain is 72.55% and what explains this is that the losses are smaller than the gains. Wave’s failures also account partially for the loosing trades. Alcoa is even worst with a 50-50 trade split and again the percent gain is 22.83%.
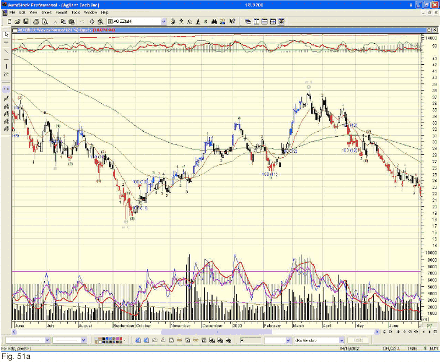
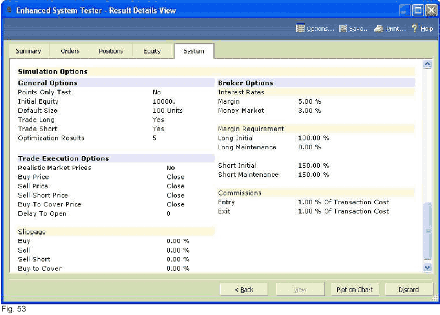
The system parameters are shown in Fig. 51. There is no delay in the execution of the order because the delay is already built in the system code. When looking at the chart in Fig. 47 with the buy and sell signals, it is obvious that a one bar delay is used. The interest rate was realistic at the time the system was run and the same could be said about the commission rate. The closing price is used on all 4 types; technically, the open should be used for long exit and short exit. Many systems will give a common signal for entering long and exiting short. Unless you set up your system to accept more than one trade per bar, you will miss signals and the results will be wrong. AlphOmega systems use a common signal for in and out, so be careful on how you use them.
The systems are not optimized for a market or price range other than the sensitivity base, so if a high sensitivity is used on a non volatile market like indices, there will be no trade. The reverse is also true for you will get too many trades. A new system test, AlphOmega Elliott Impulses (21%) has been introduced. This system will give a signal for all impulses as soon as the price retracement is attained. It will exit in correction moves. The signals between The Explorer™ and the Enhanced System Tester™ do not always match as they are two different modules and the space allowed for formulas differs; to overcome this problem, the formulas were moved in the Indicator Builder™ and are accessed from the two modules, yielding the same results. The drawback is minimal in the tester as it measures in milliseconds of execution; it is more noticeable in the exploration. For this reason, the change is limited to the new exploration AlphOmega Elliott Impulses (21%) DF* and this system test. A complete summary is proposed on the next page (Fig. 52).
All system tests will produce these reports and it is worth our time to scrutinize them before we blow our horn about a trading system. Optimization should never be used to evaluate the trading mechanics of a system; optimization is excellent to fine tune our trading signals once we are satisfied that the system executes properly the code (optimization should not mask inefficiencies with its benefits). Many of us will try to use the system tester as signal generator for trades. First we should know that the indicators do not function the same way in the system tester as on the chart; No matter how we write the code, we will never match precisely the buy and sell signals from the system tester to our indicators. In addition to running our indicators, the system tester has its own logic and code to deal with user parameters such as delay, stop loss and more. It cannot deal with 2 signals on the same bar and yet it will exit long and enter short on the same bar. Nevertheless we must strive to make indicators that will issue signals on time and check the system tester code to see if it parallels the indicator signals or is at least reasonably accurate.
Other System Tests
AO Elliott (Ind) is a system test that will scan for waves generated by a user specified indicator (not the price). So we could trade on the waves of the RSI for example. This system uses the P variable from MetaStock®.
AO Elliott Waves Normal + EMA is similar to the other system test but will exit on a cross of the exponential moving average. These variations on the base theme seek a faster exit signal.
AO Elliott Waves w/Opt is the same but the sensitivity is optimized with values between 3 and 50% in increments of 1%. Only the triggers are used to enter or exit a trade.
AO Elliott WolfWave is testing the well-known pattern. As mentioned several times, this pattern assumes a wave failure, so its results are mitigated. The sensitivity used is 21%.
AO TSI is the system test of this adaptive moving average (similar to Vidya).
AOi are the same as the system tests described above, only the sensitivity is reduced and in principle the test should be performed on intra day data or very low volatility securities.
Next: Experts
Summary: Index